Member-only story
The Architecture of Prometheus
This article explains the Architecture of Prometheus.
Overview

Key Architectural Elements
Prometheus Server
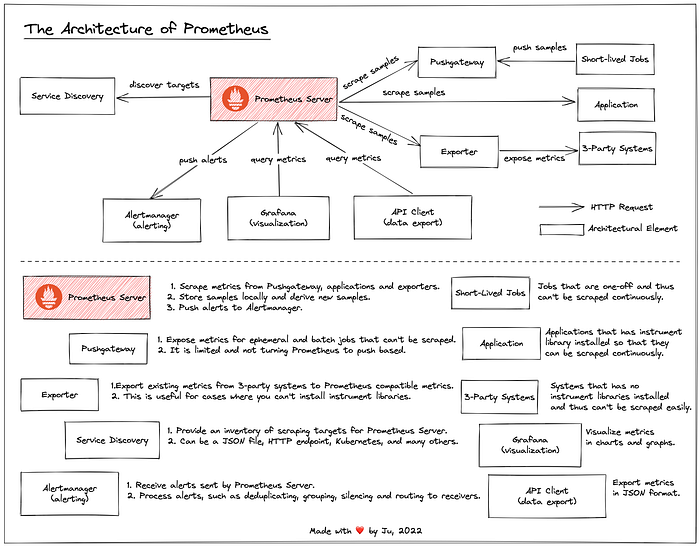
Prometheus Server is the central architectural element. It is well written in Golang and is battle tested. It performs the following tasks:
- Discover targets from service discovery.
- Pull metrics from targets. The targets can be applications, pushgateway or exporters.
- Store metrics as time-series data.
- Apply rules to derive new metrics and generate alerts.
- Provide time-series data via HTTP API for further uses, such as visualization and data exporting.
Some key takeaways:
- Prometheus Server combines the data collector and data storage functionality that some other monitoring solution may choose to separate into two components. The benefit is Prometheus Server becomes full-fledged and can be deployed in a distributed manner. The downside is Prometheus Server is bound to a single machine’s limitation.
- Prometheus Server has a “rule engine” that performs lightweight data processing. The benefit is Prometheus Server can improve the user experience. The downside is Prometheus Server’s performance could be impacted due to heavy background computations.
Applications
To monitor applications, Prometheus instrument library is installed into application. When the application is started, Prometheus can scrape the metric data generated by the instrument library.
Pushgateway
Pushgateway is a standalone application in the Prometheus ecosystem that exposes metrics for ephemeral and batch jobs that can’t be scraped.
We do we need Pushgateway? Because the lifecycle of those jobs are too short for Prometheus continuously scraping metrics. Instead, those jobs push metrics to pushgateway and then Prometheus scrapes metrics from pushgateway. Note that Pushgateway does not change the “pull” model of Prometheus server.

